Dot Your Story
1. Research + Inspiration
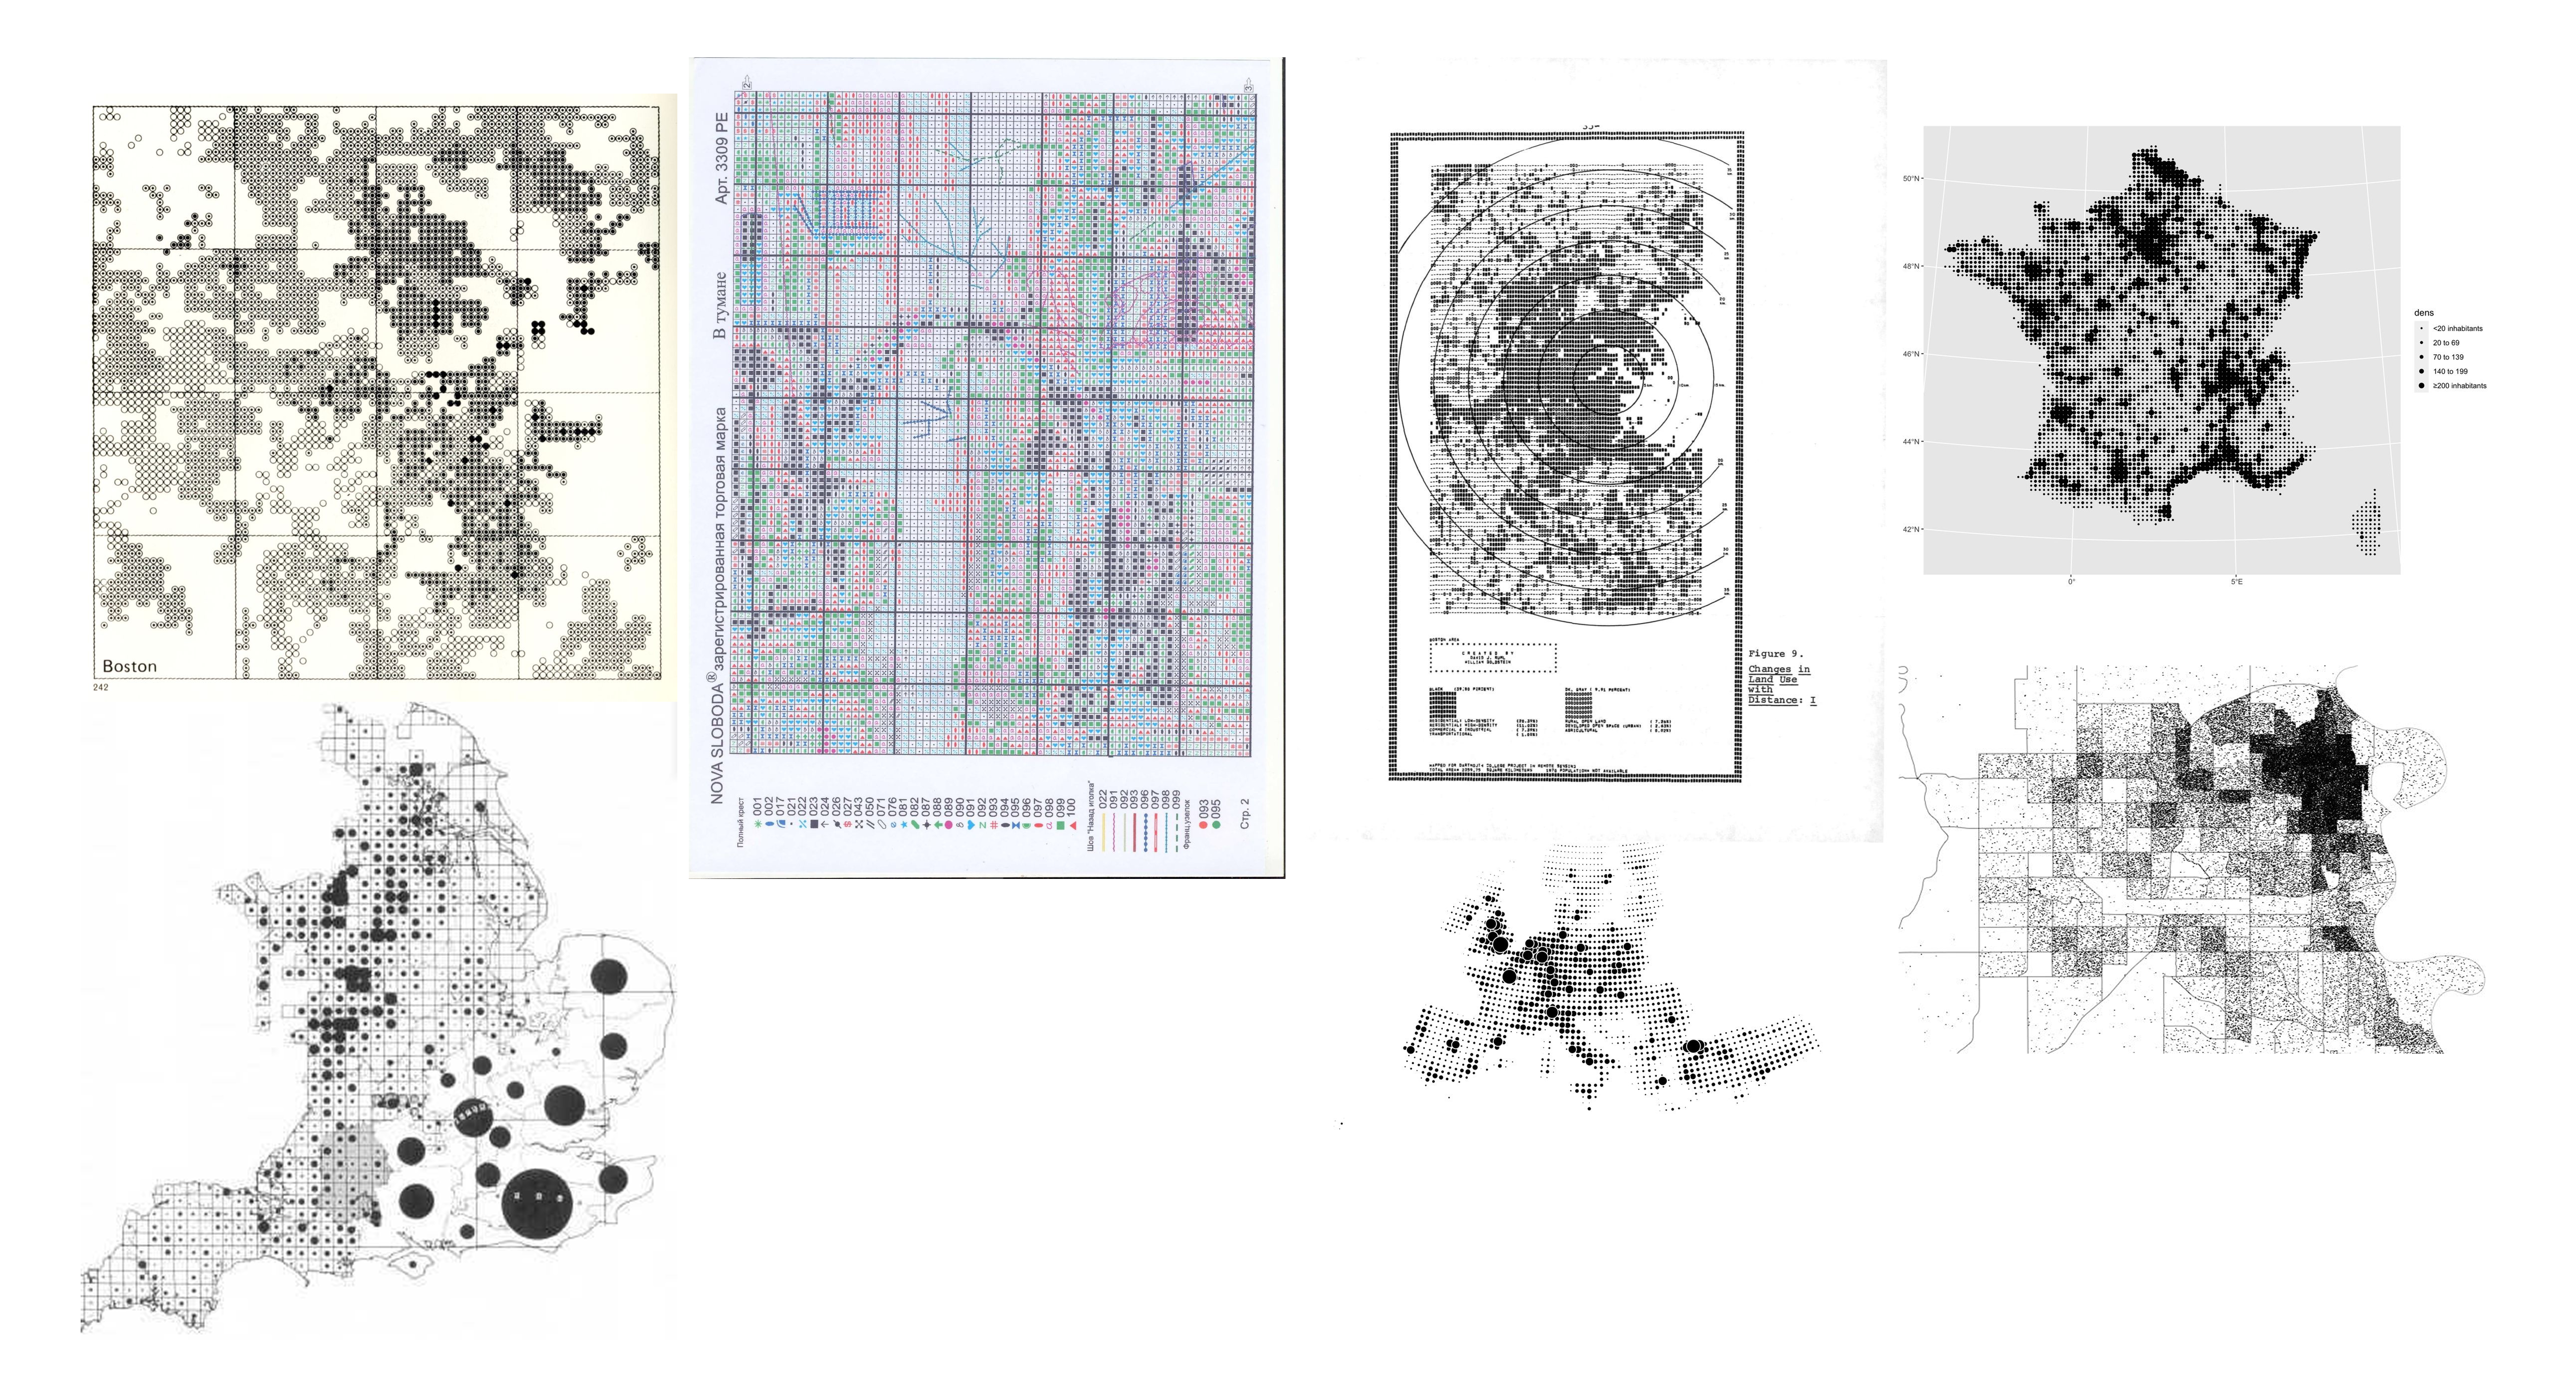
This project grew out of my Week 2 assignment where I created a page about my hometown. I became interested in how a map can convey a personal story and how I can effectively share those stories on the web. I started looking at ASCII art and dot-density cartography — ways of visualizing geography through patterns of simple repeated shapes. I found this beautiful dot map of Boston where the density and fill of tiny circles actually form the shape of the city. That got me thinking: what if these dots weren’t just data points, but actual stories from real people? I wanted to combine that visual style with community input — what if we, as a community, create our own collective map of NYC?
These are some sites and references that inspired me:
- My Week 2 Hometown Project — my starting point, where I first explored representing a place on the web
- Dot map of Boston (Pinterest) — dot-density cartography that inspired the ASCII visual style
- claimyourpixel.online — the mechanic of claiming space on a shared grid with strangers
- WindowSwap — strangers sharing small personal moments with each other
- The Million Dollar Homepage — a grid that fills up over time and becomes a collective artifact
mood board
 -keywords i used to find these reference in Pinterest : dot-density cartography, Ascii art
∘◉○◌◍◎●◐◑◒◓◔◕◦∘◦⊚⊙◦◦∘•◌●⊙⊚○◎◉∘◉○◌◍◎●◐◑◒◓◔◕◦∘◦⊚⊙◦◦∘•◌●
2. Concept
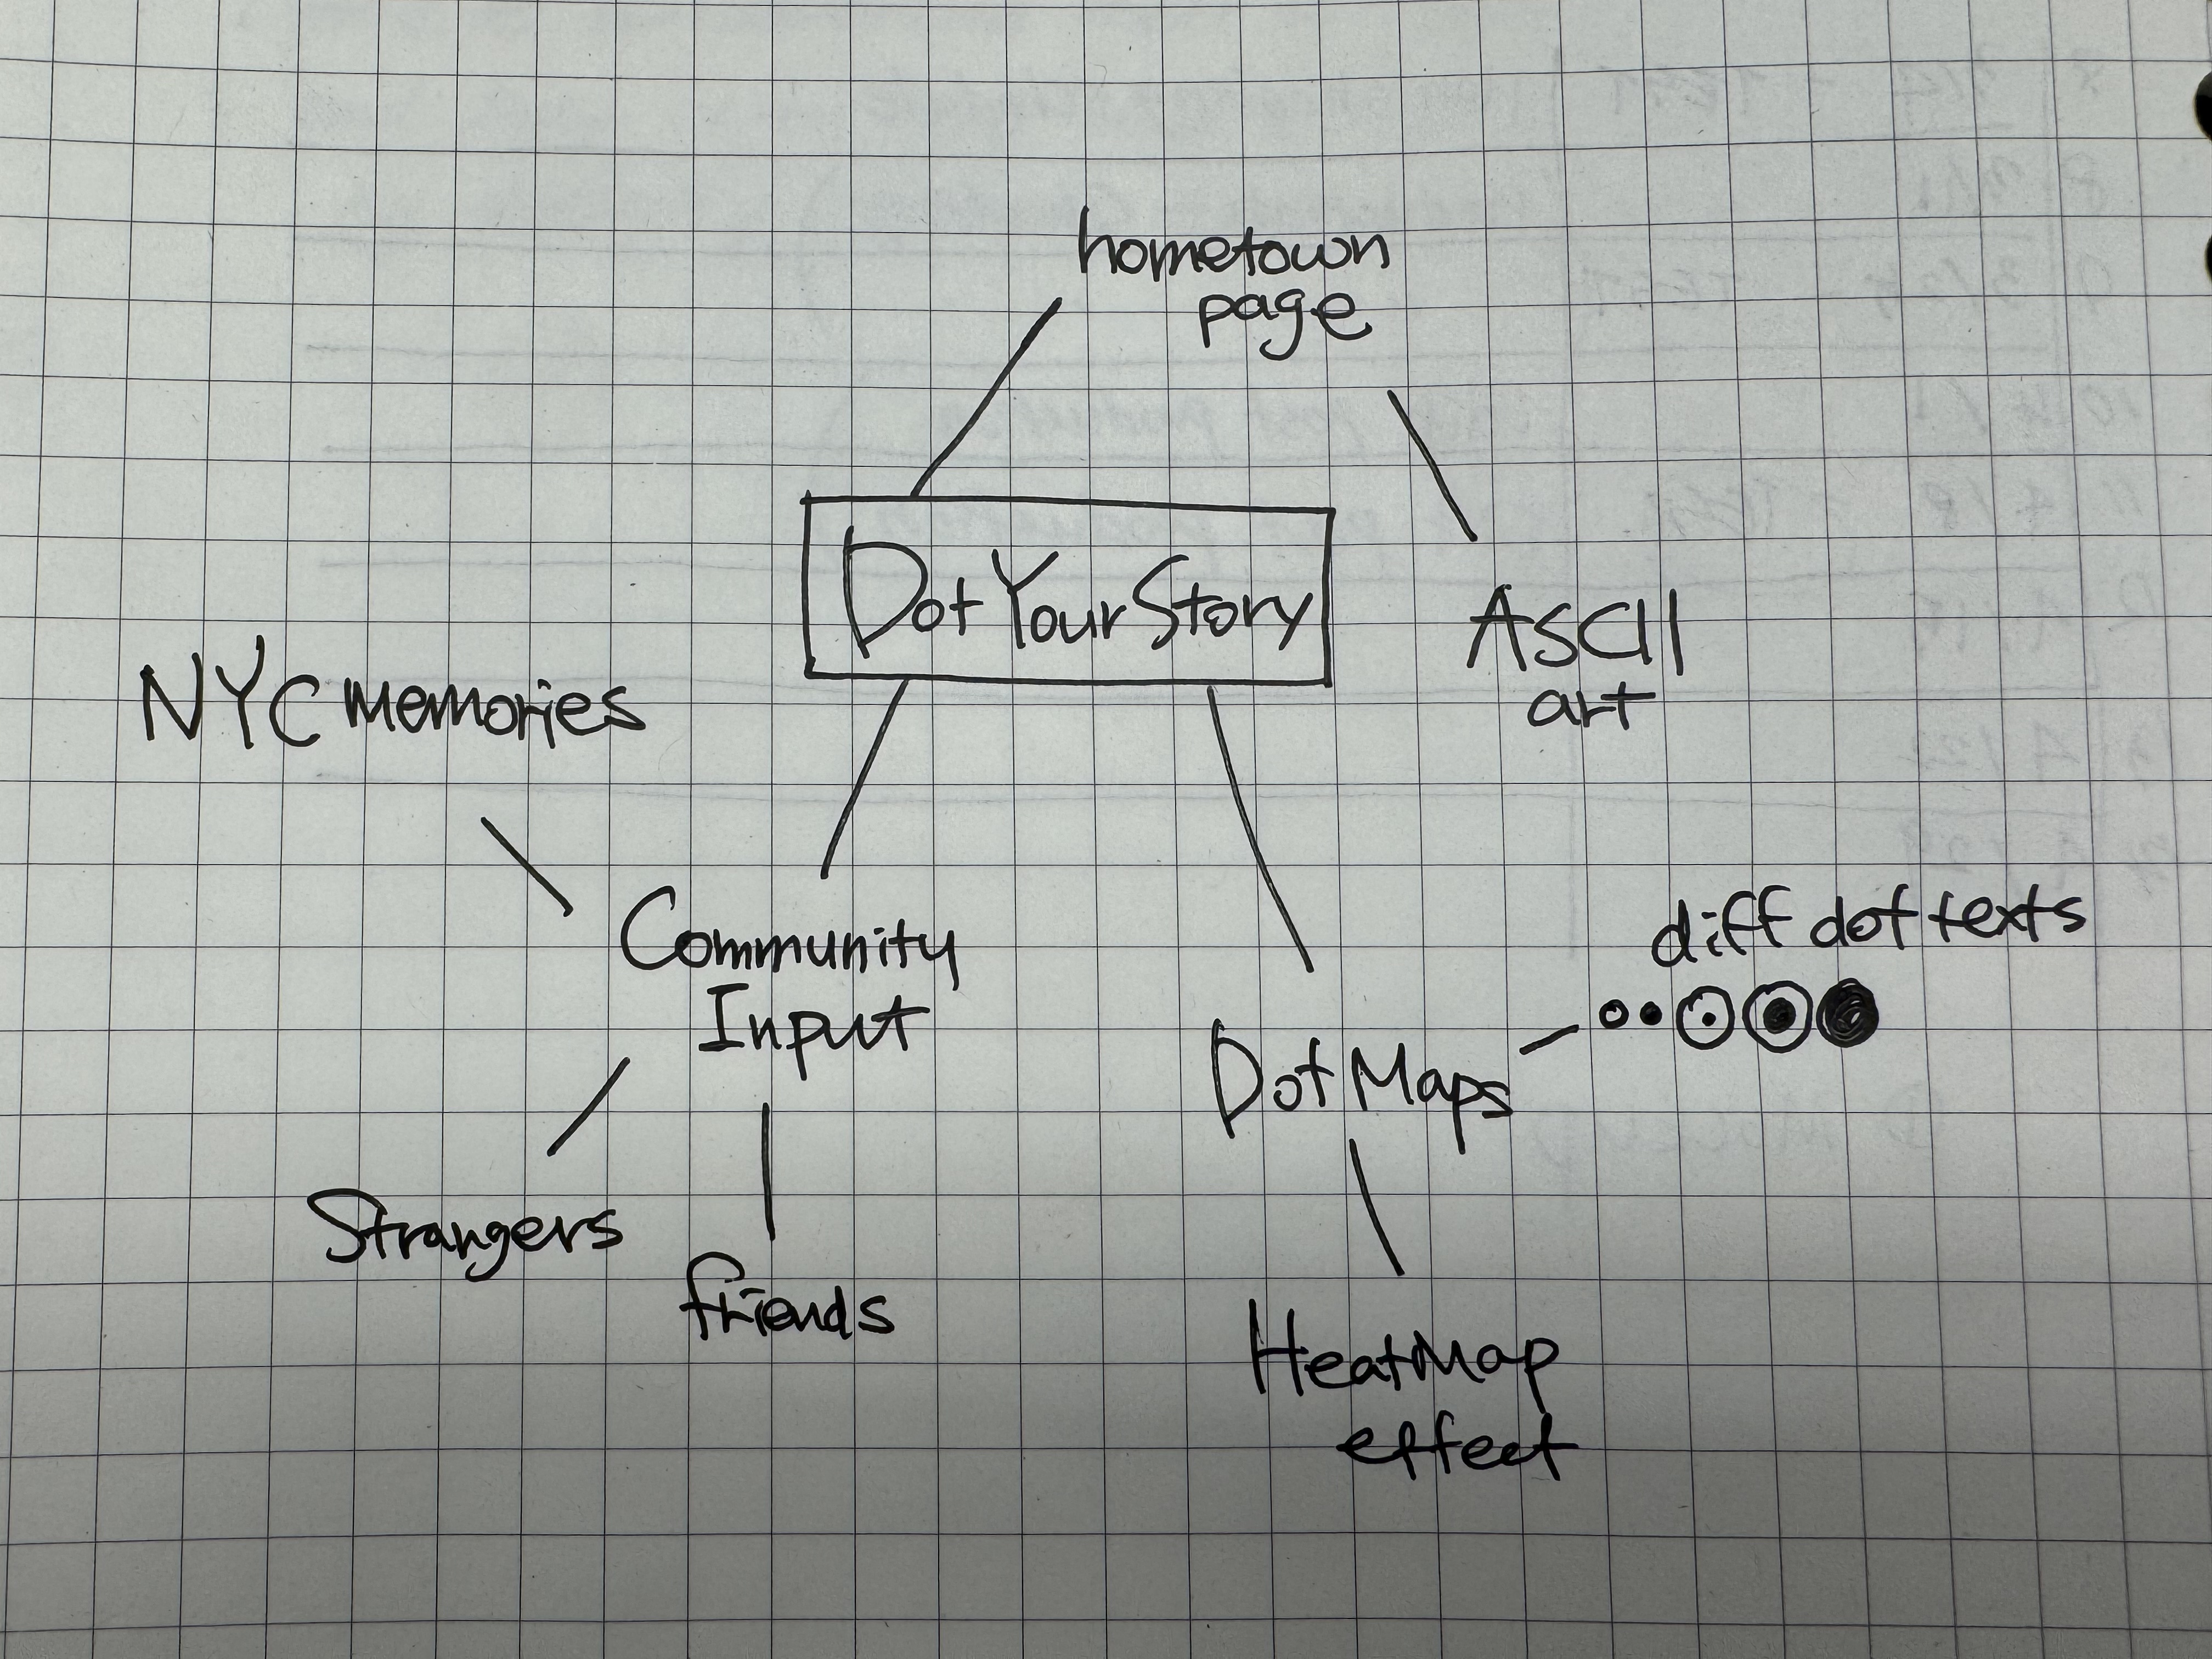
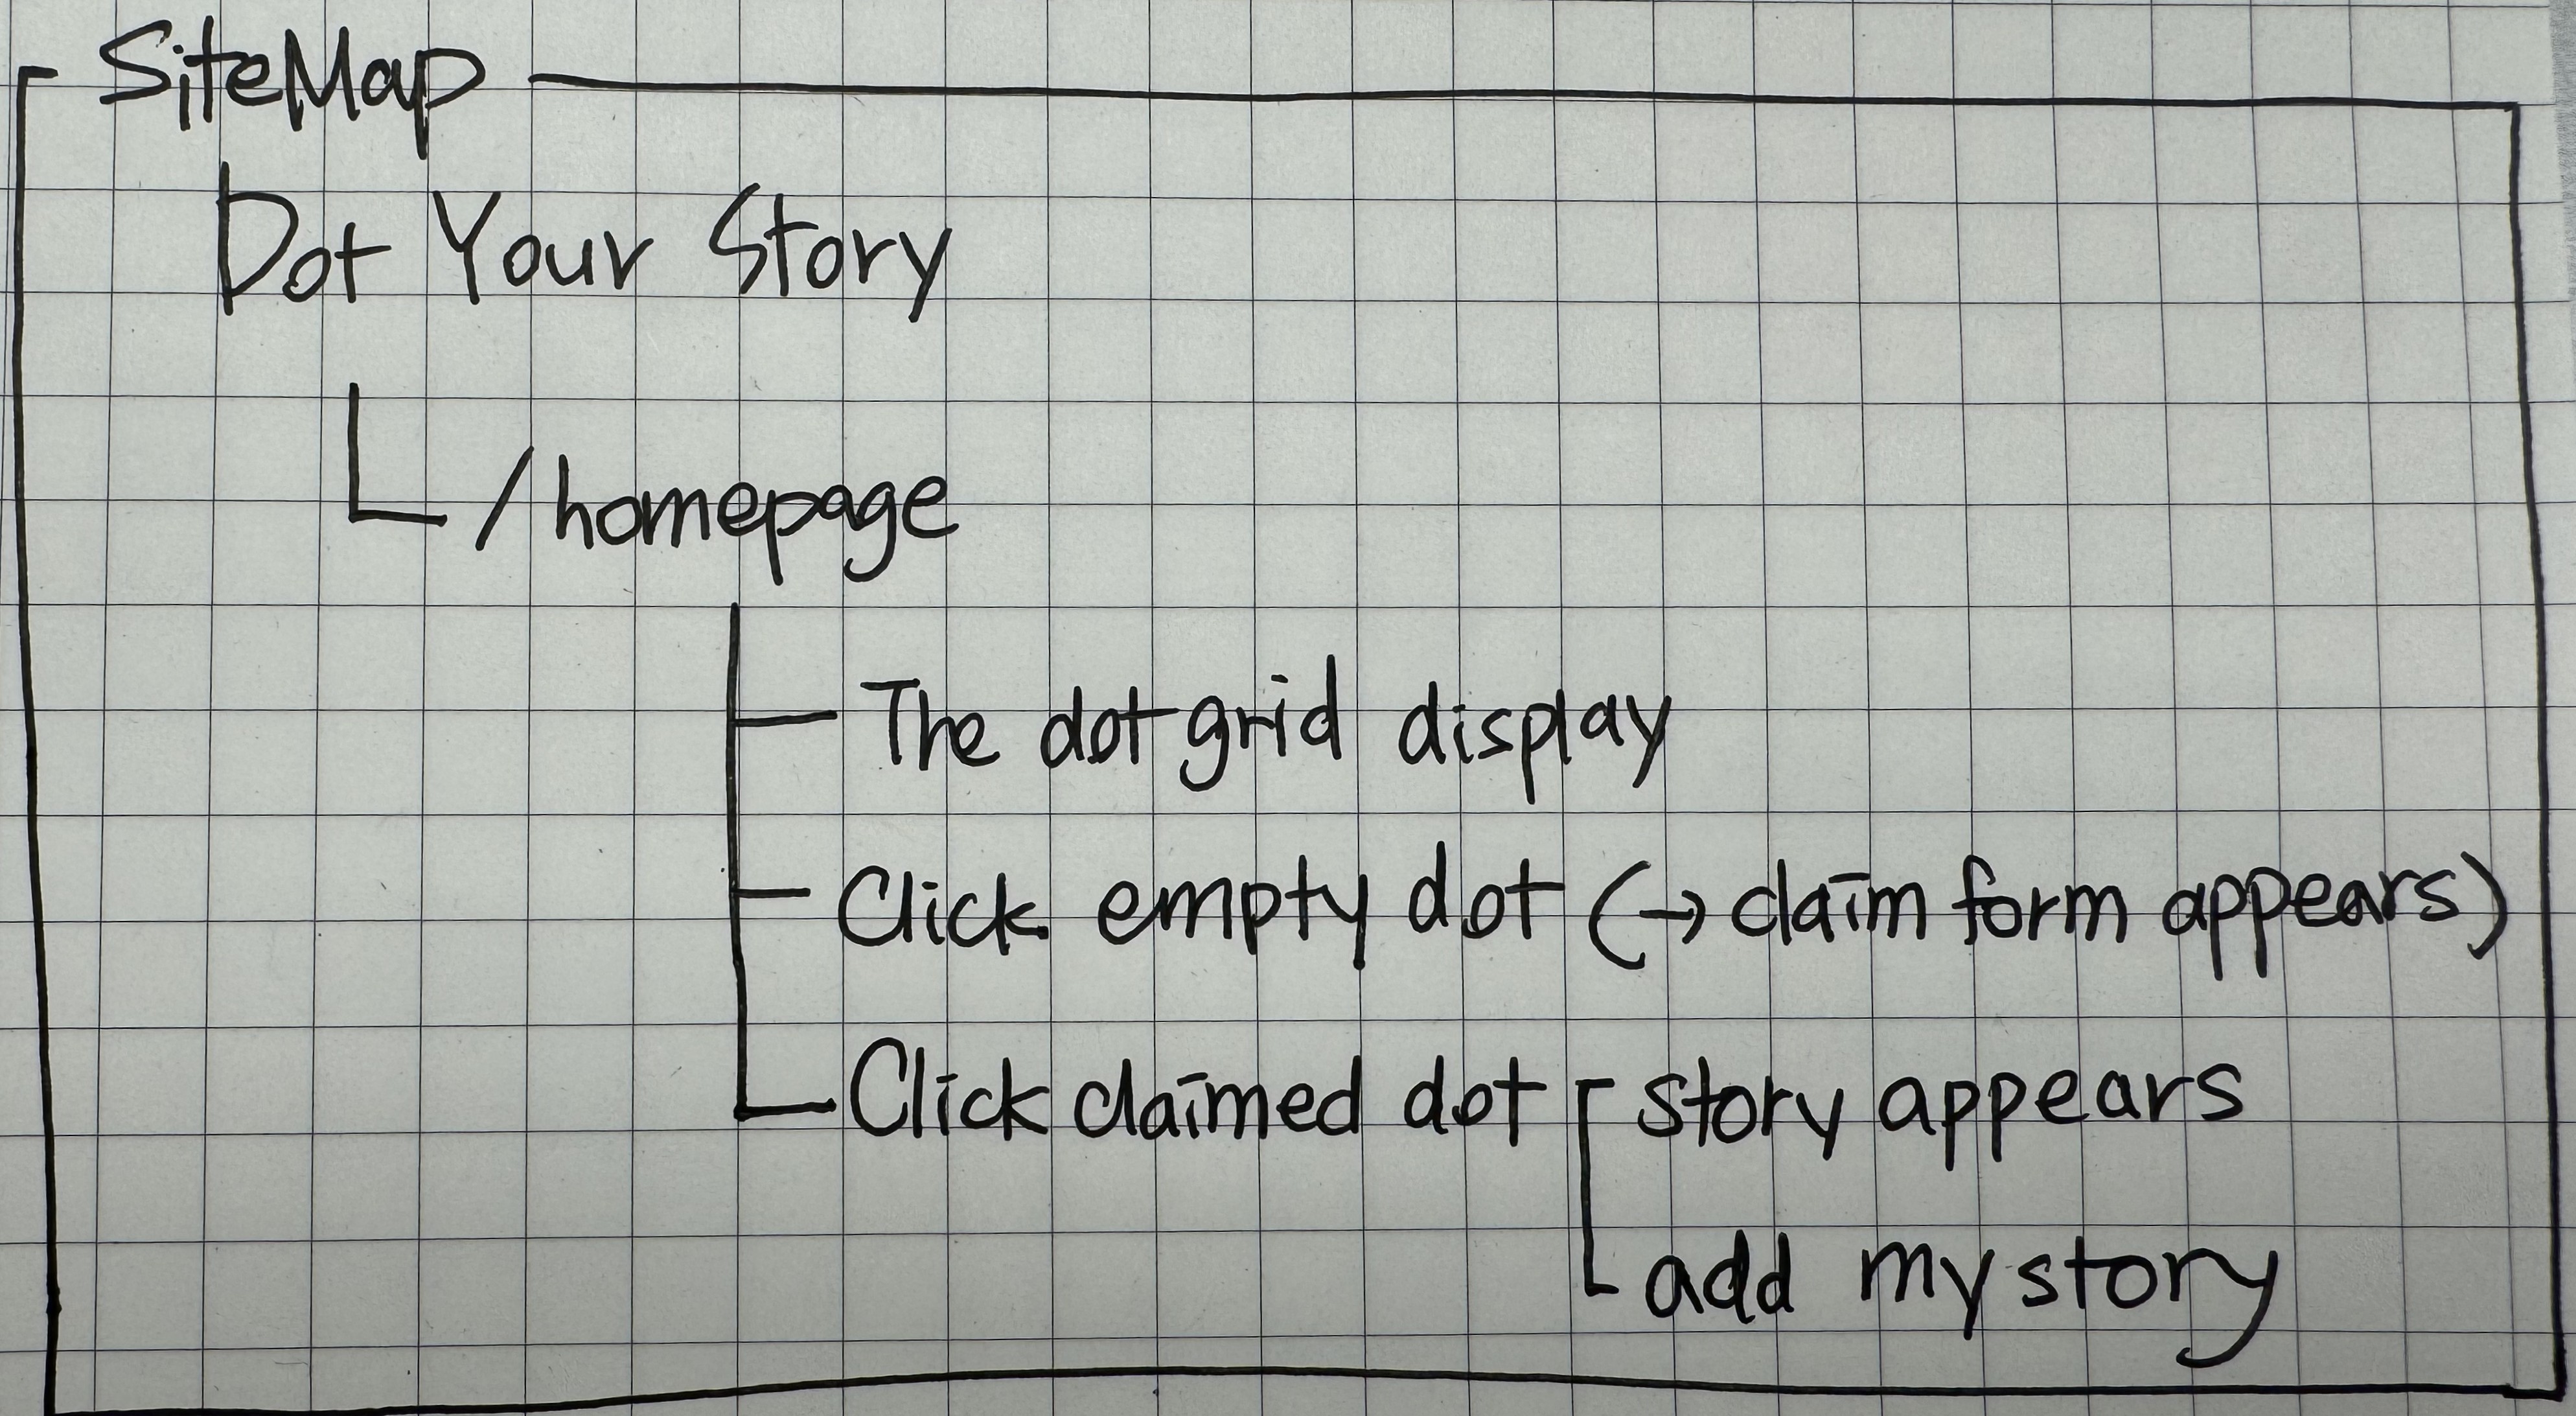
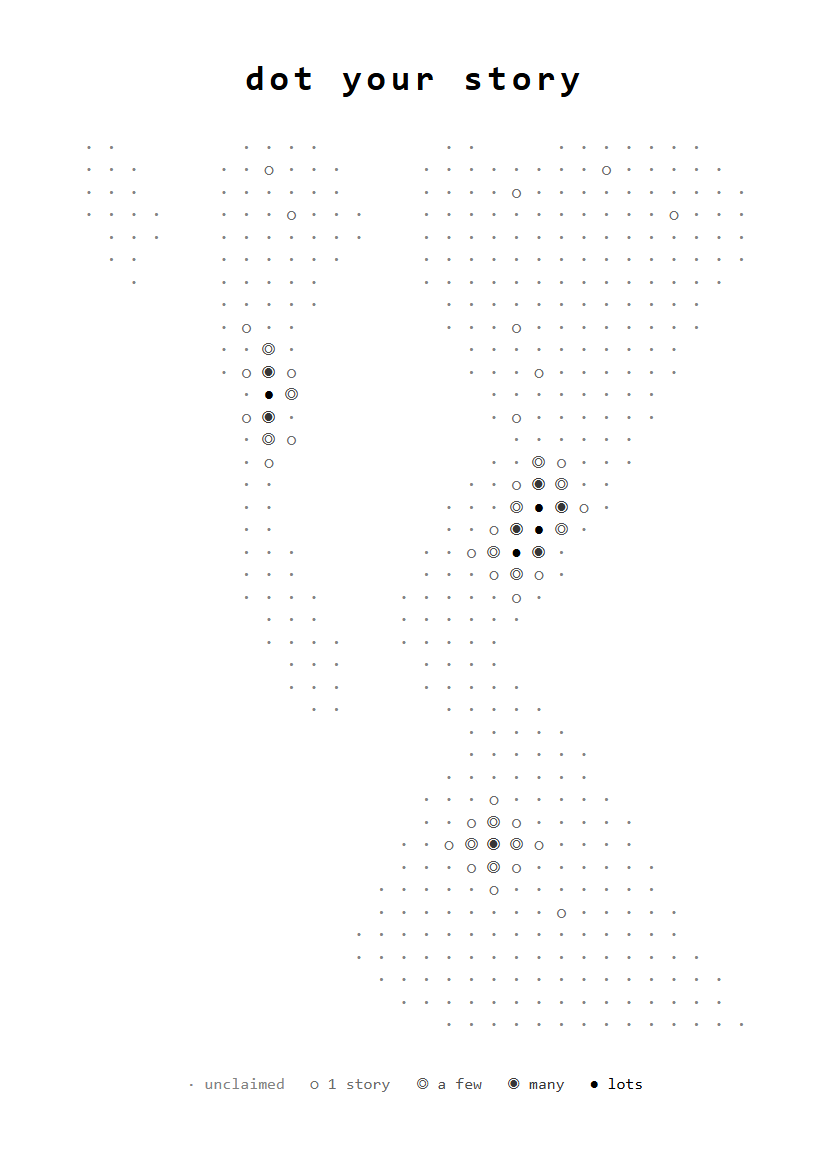
“Dot Your Story” is a community-driven website where visitors leave their personal NYC stories on an abstract dot grid of the city. The page starts as a field of empty dots, loosely arranged in the shape of NYC. When you click on a dot, you can claim it by sharing your favorite spot in that area and why it matters to you. Each time someone claims a dot, it fills in a little more — going from a faint outline to a solid filled circle. Dots that many people have claimed become bolder and darker, showing which parts of the city hold the most stories.
Over time, the grid slowly comes alive. The shape of the city emerges not from a map, but from the stories people leave behind. It’s a living, collective portrait of NYC built one dot at a time.
The idea interests me because I’m curious about how we experience the same city in completely different ways. Everyone has their own version of NYC — their own corner, their own spot, their own memory. This project makes those invisible personal maps visible, layered on top of each other.
mindmap
∘◉○◌◍◎●◐◑◒◓◔◕◦∘◦⊚⊙◦◦∘•◌●⊙⊚○◎◉∘◉○◌◍◎●◐◑◒◓◔◕◦∘◦⊚⊙◦◦∘•◌●
3. Information Architecture + User Experience
Sitemap
User Flow
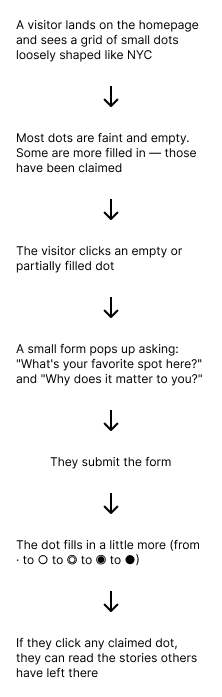
wireframe
page1- homepage
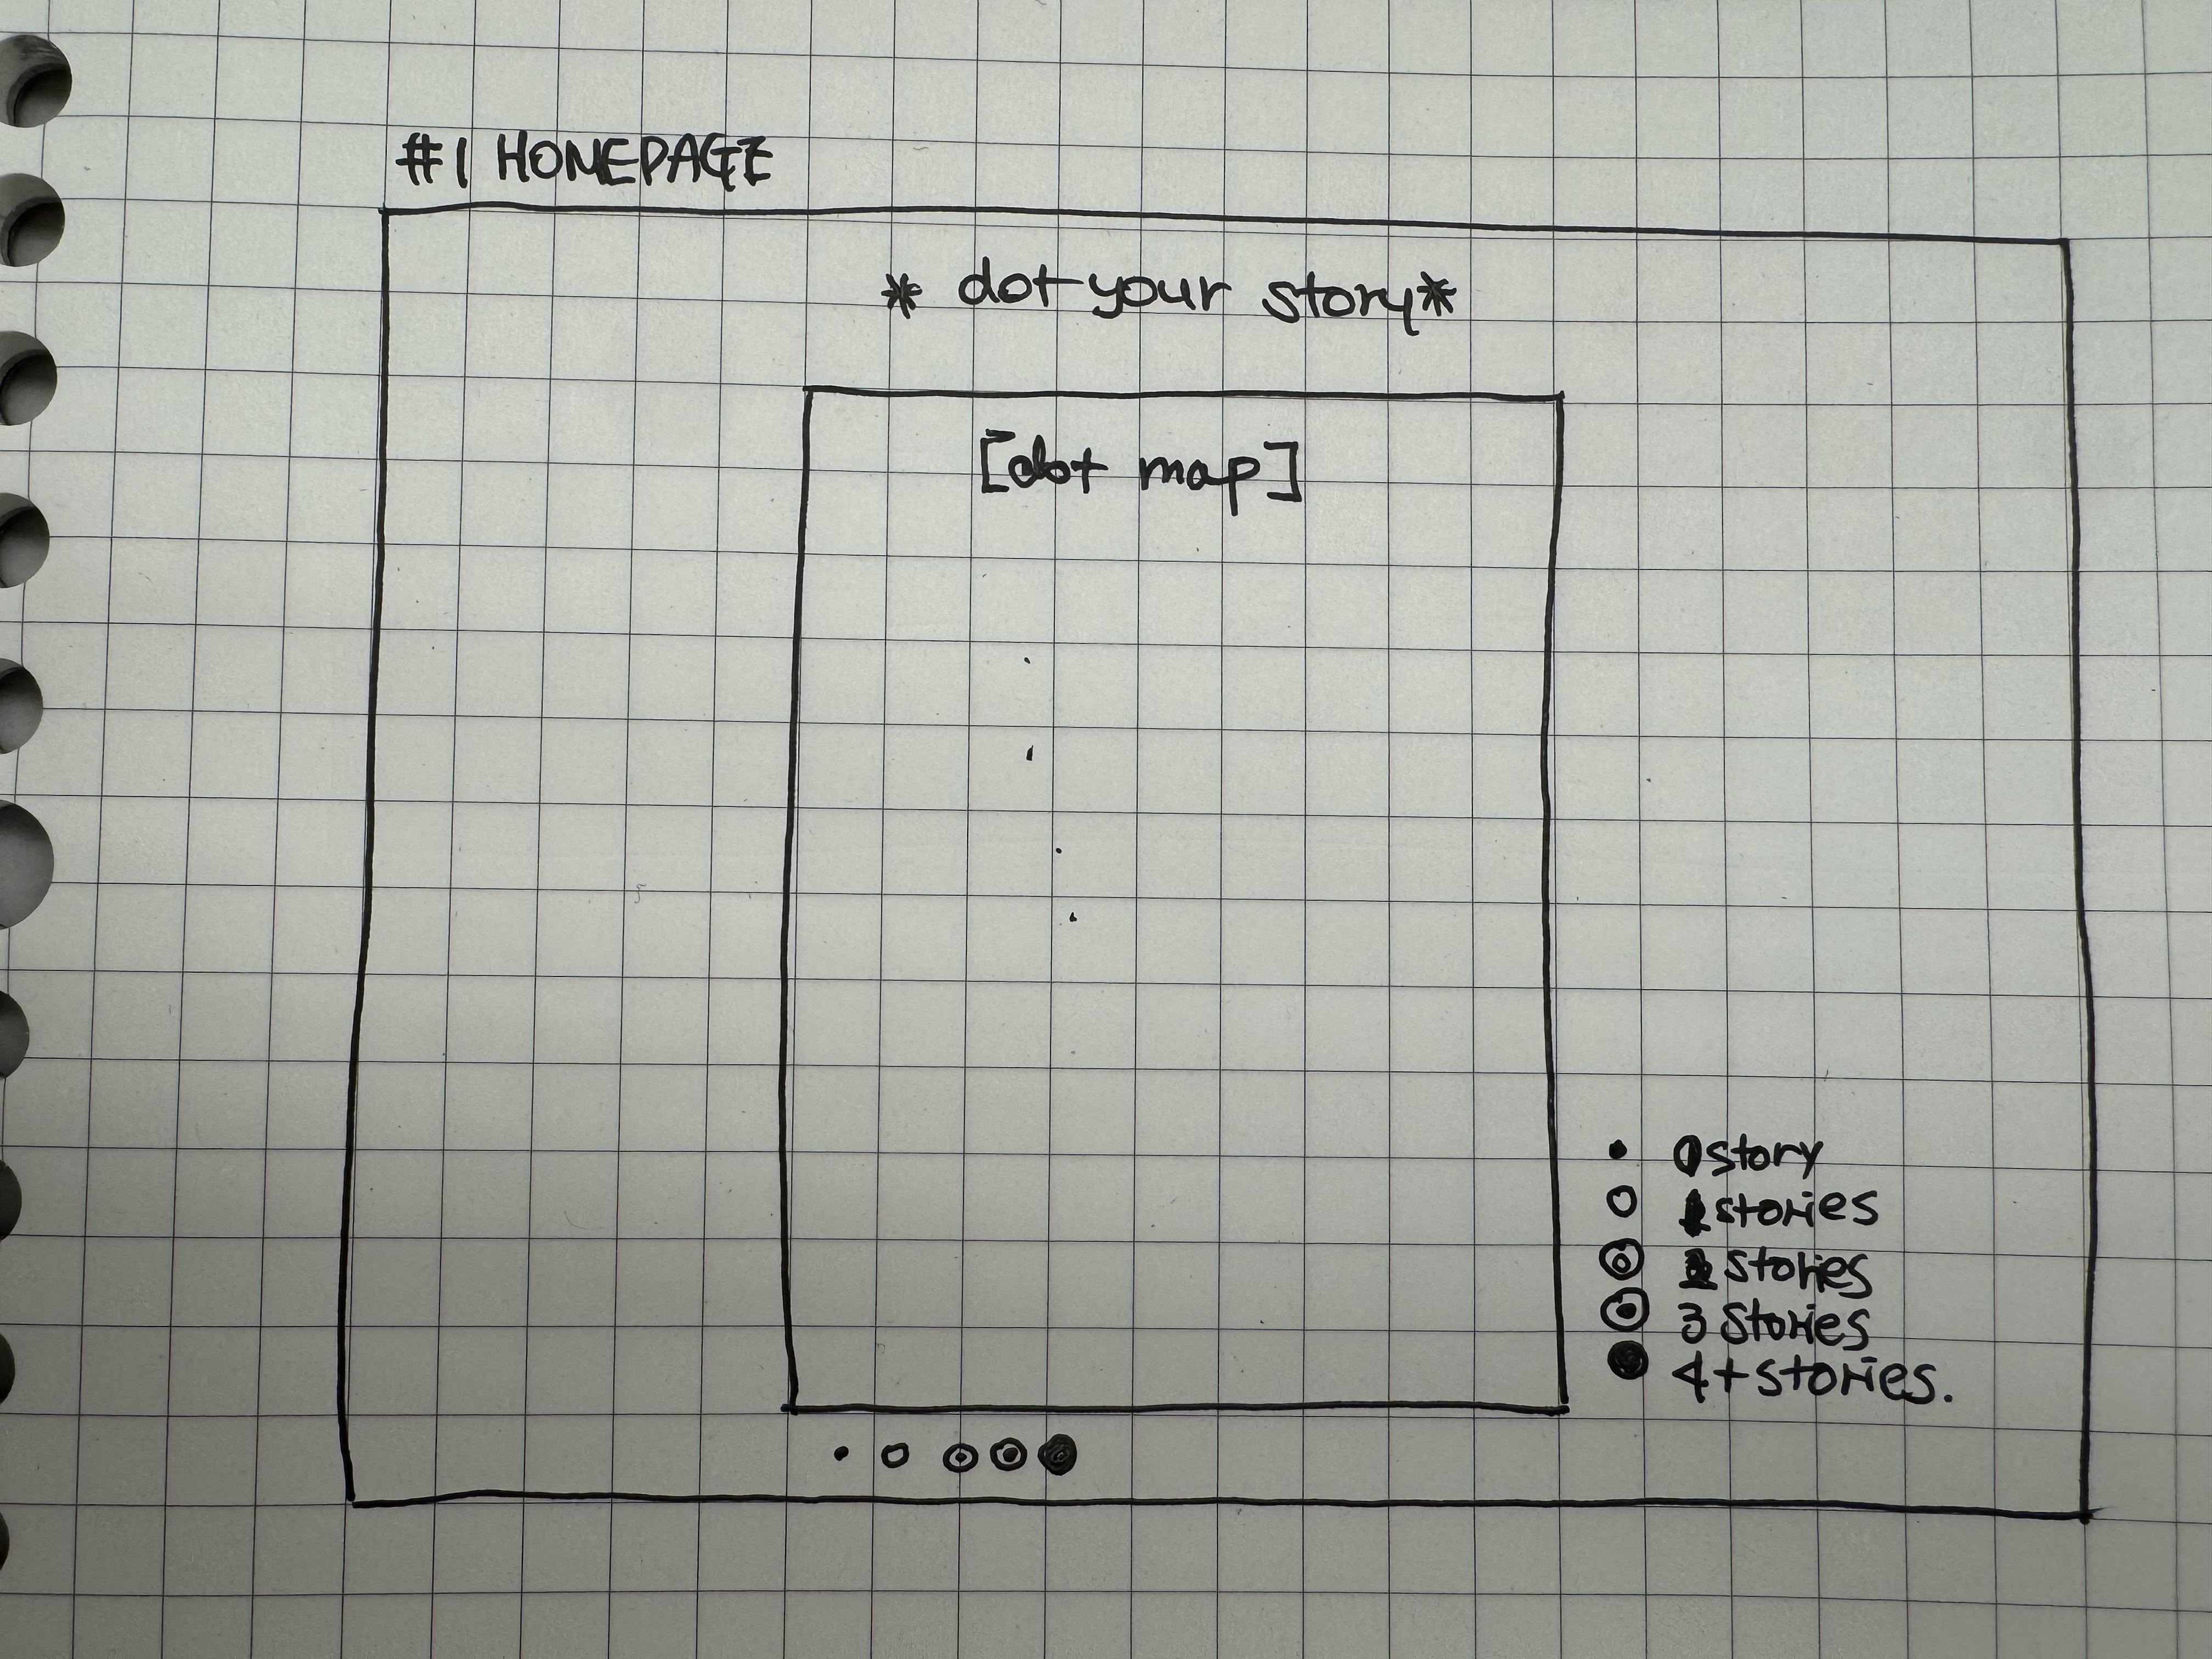 page2- popup page
4. Visual Design
### Color
The page background and UI will use a neutral, muted tone so the dots themselves are the visual focus. Unclaimed dots start as light grey. As dots get more claims, they shift from grey to dark grey, ending at black for the most claimed spots. This creates a natural heat map effect where the most storied parts of the city visually glow. I want the minimalist visual design for this project and focus on each stories.
Typography
I want to use a clean, simple font that doesn’t fight with the dot grid for attention. i want to use a monospace font so it matches the the dot grid ASCII/data visualization aesthetic. https://www.fontshare.com/fonts/rajdhani\
Overall Aesthetic
The overall look is minimal and quiet. The page itself doesn’t try to be flashy, it lets the community-generated content be the visual. The more people contribute, the more alive the page looks. The design is the data.
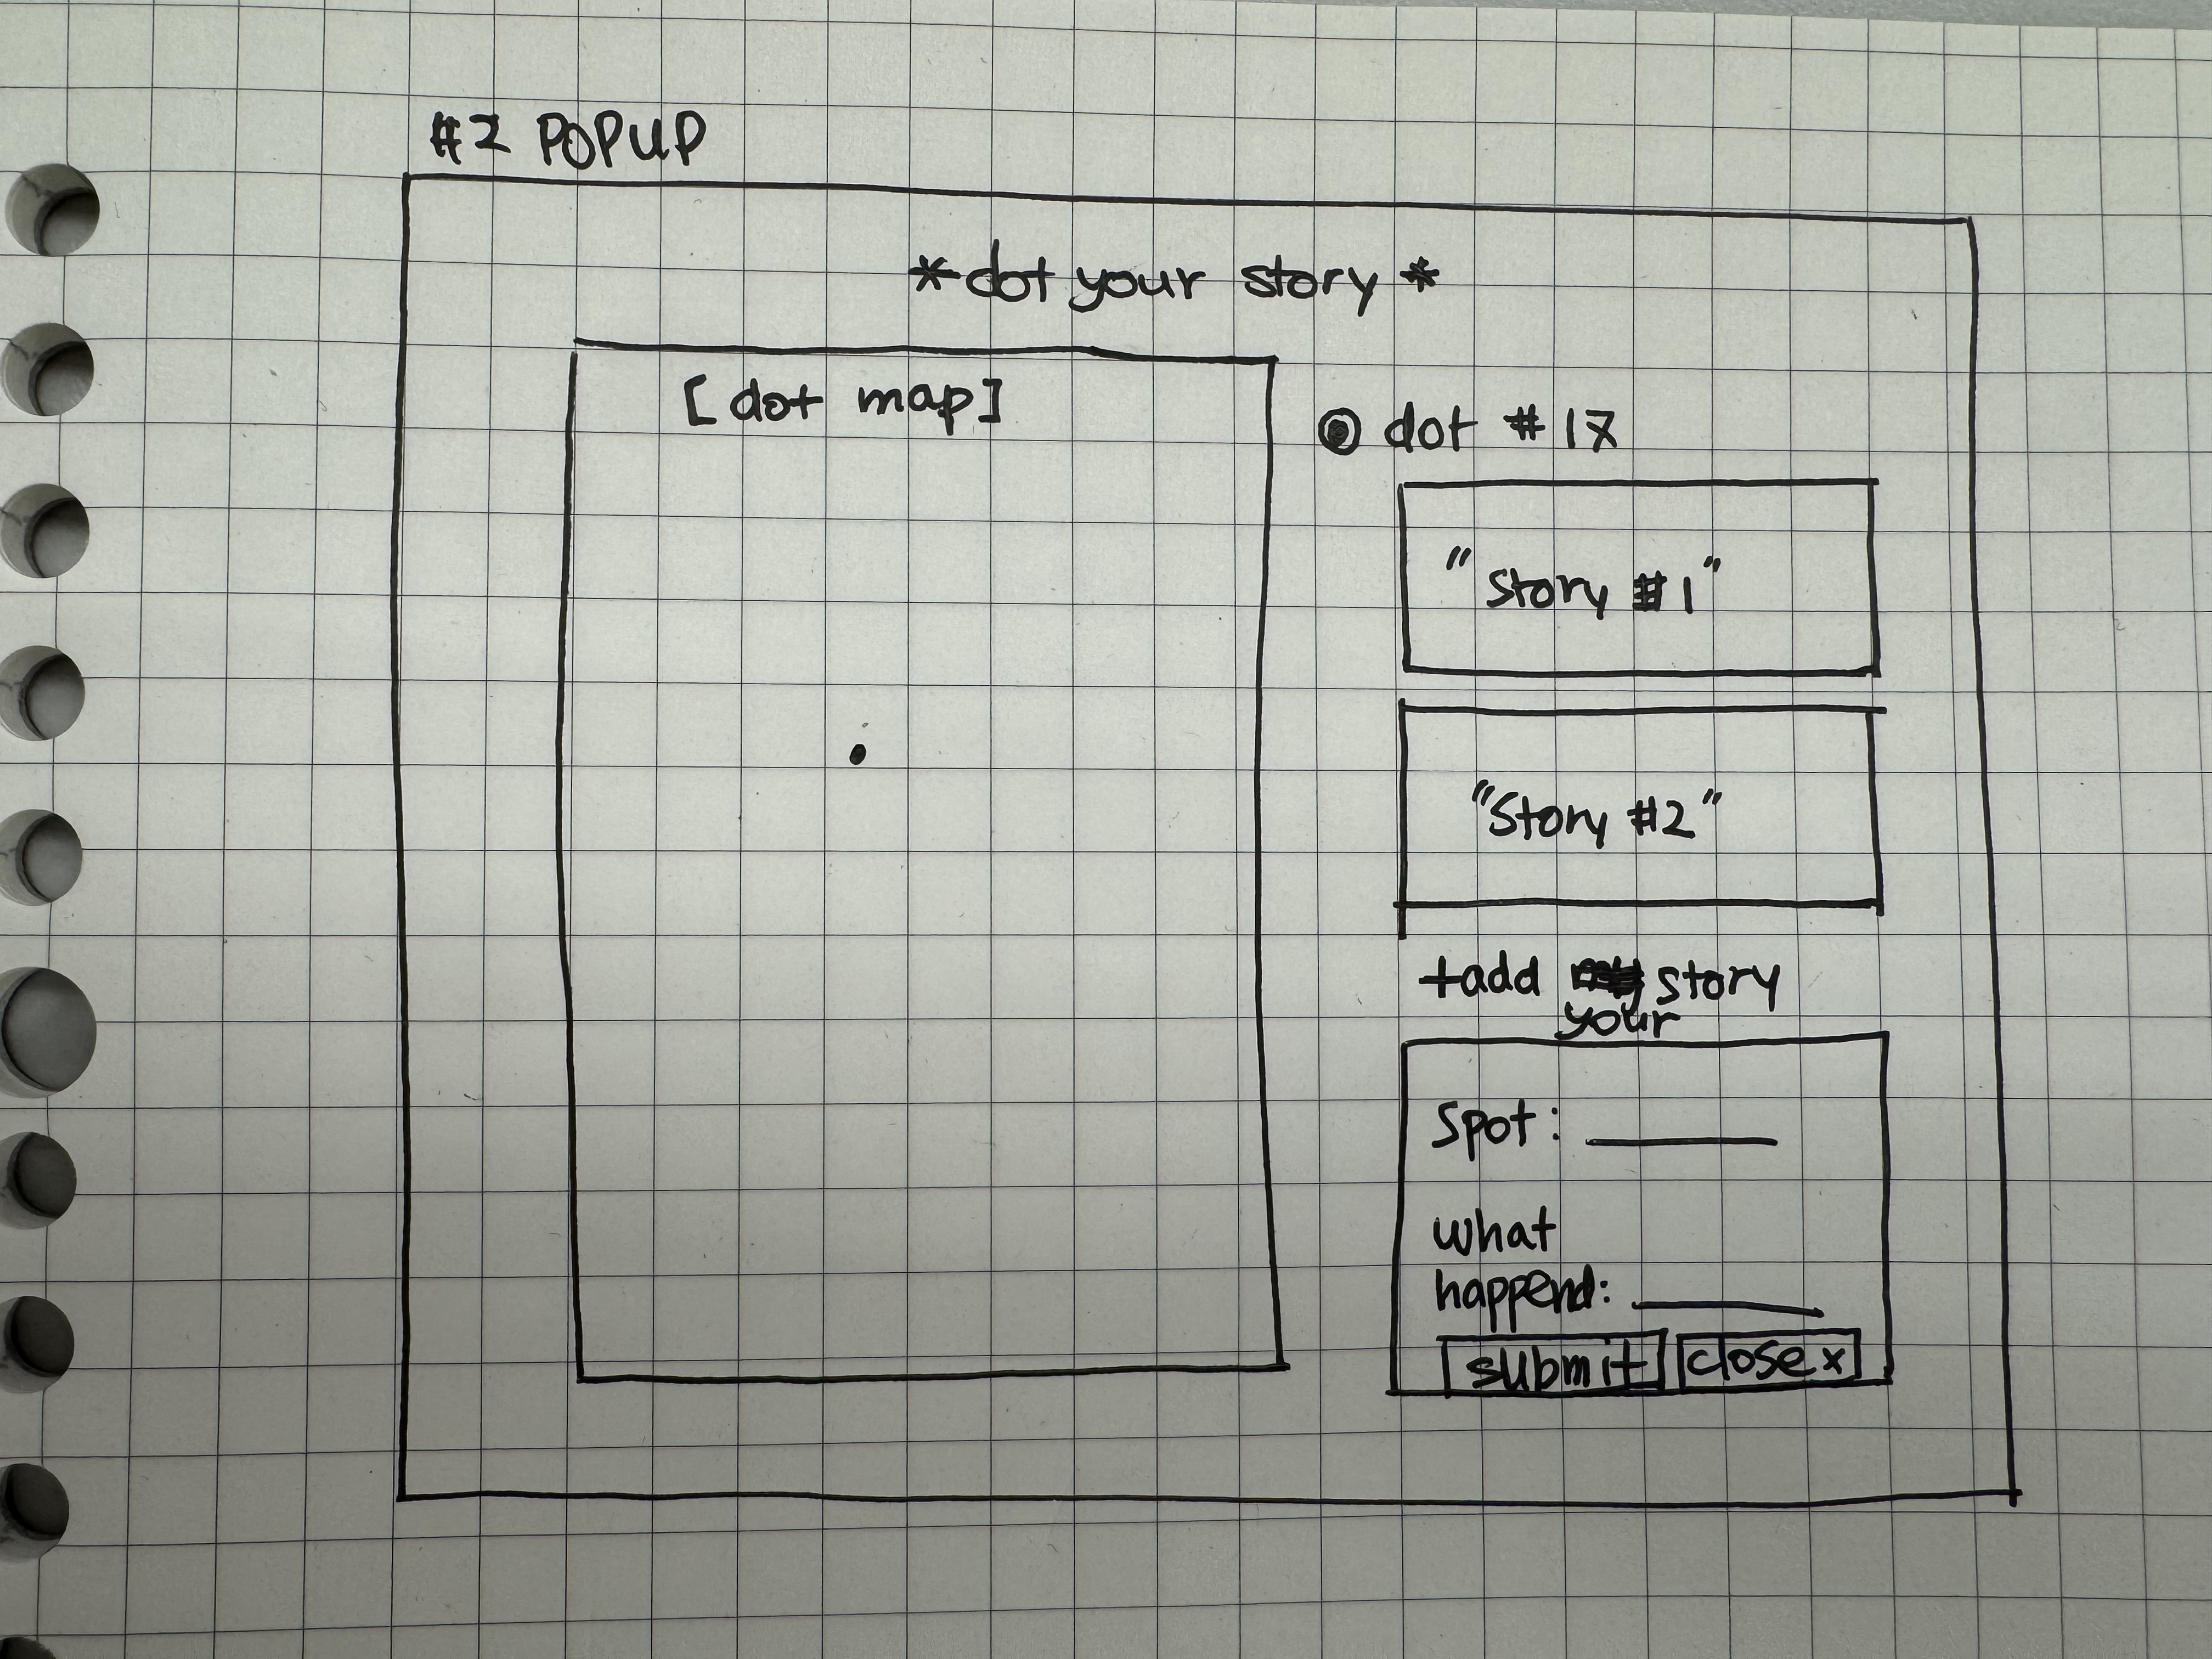
high fidelity mockup
I made hi-fi mockup by just having the mockup dots placed on the dot map.
-
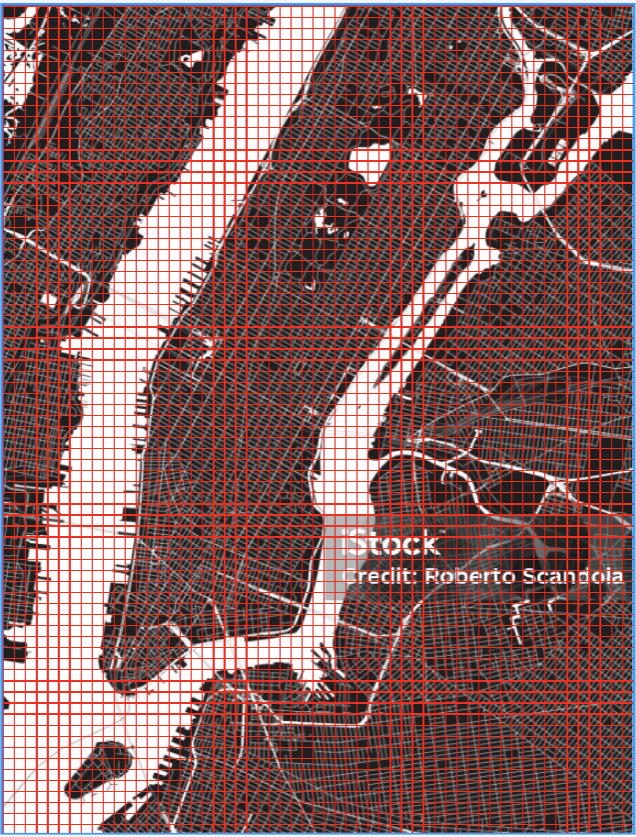
i placed a grid on top of the nyc map
-
Wrote array in code to replicate nyc map with dots.
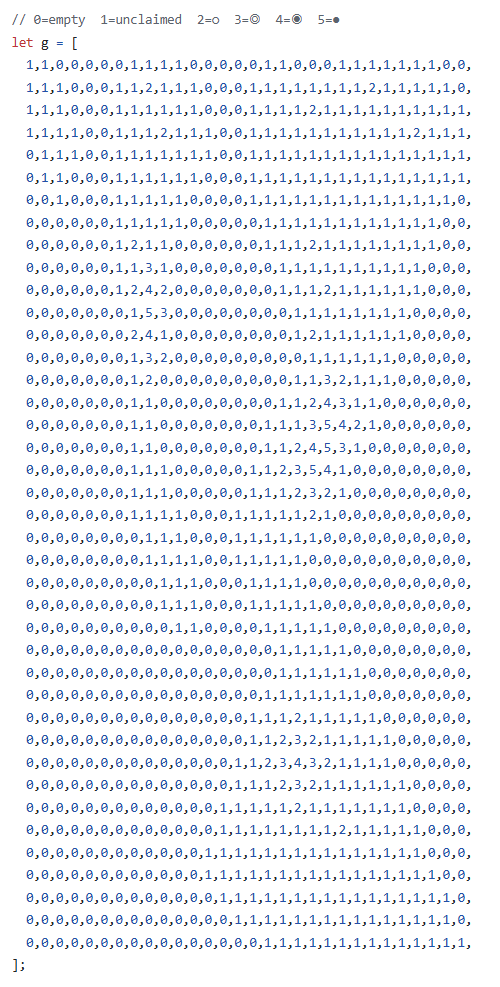
-
With some simplest html, css, js code i made a mock up image of how i want the page to look like. (here is the git hub page with the code)
i changed the reference image of the nyc map to have the dot map more resemble nyc.
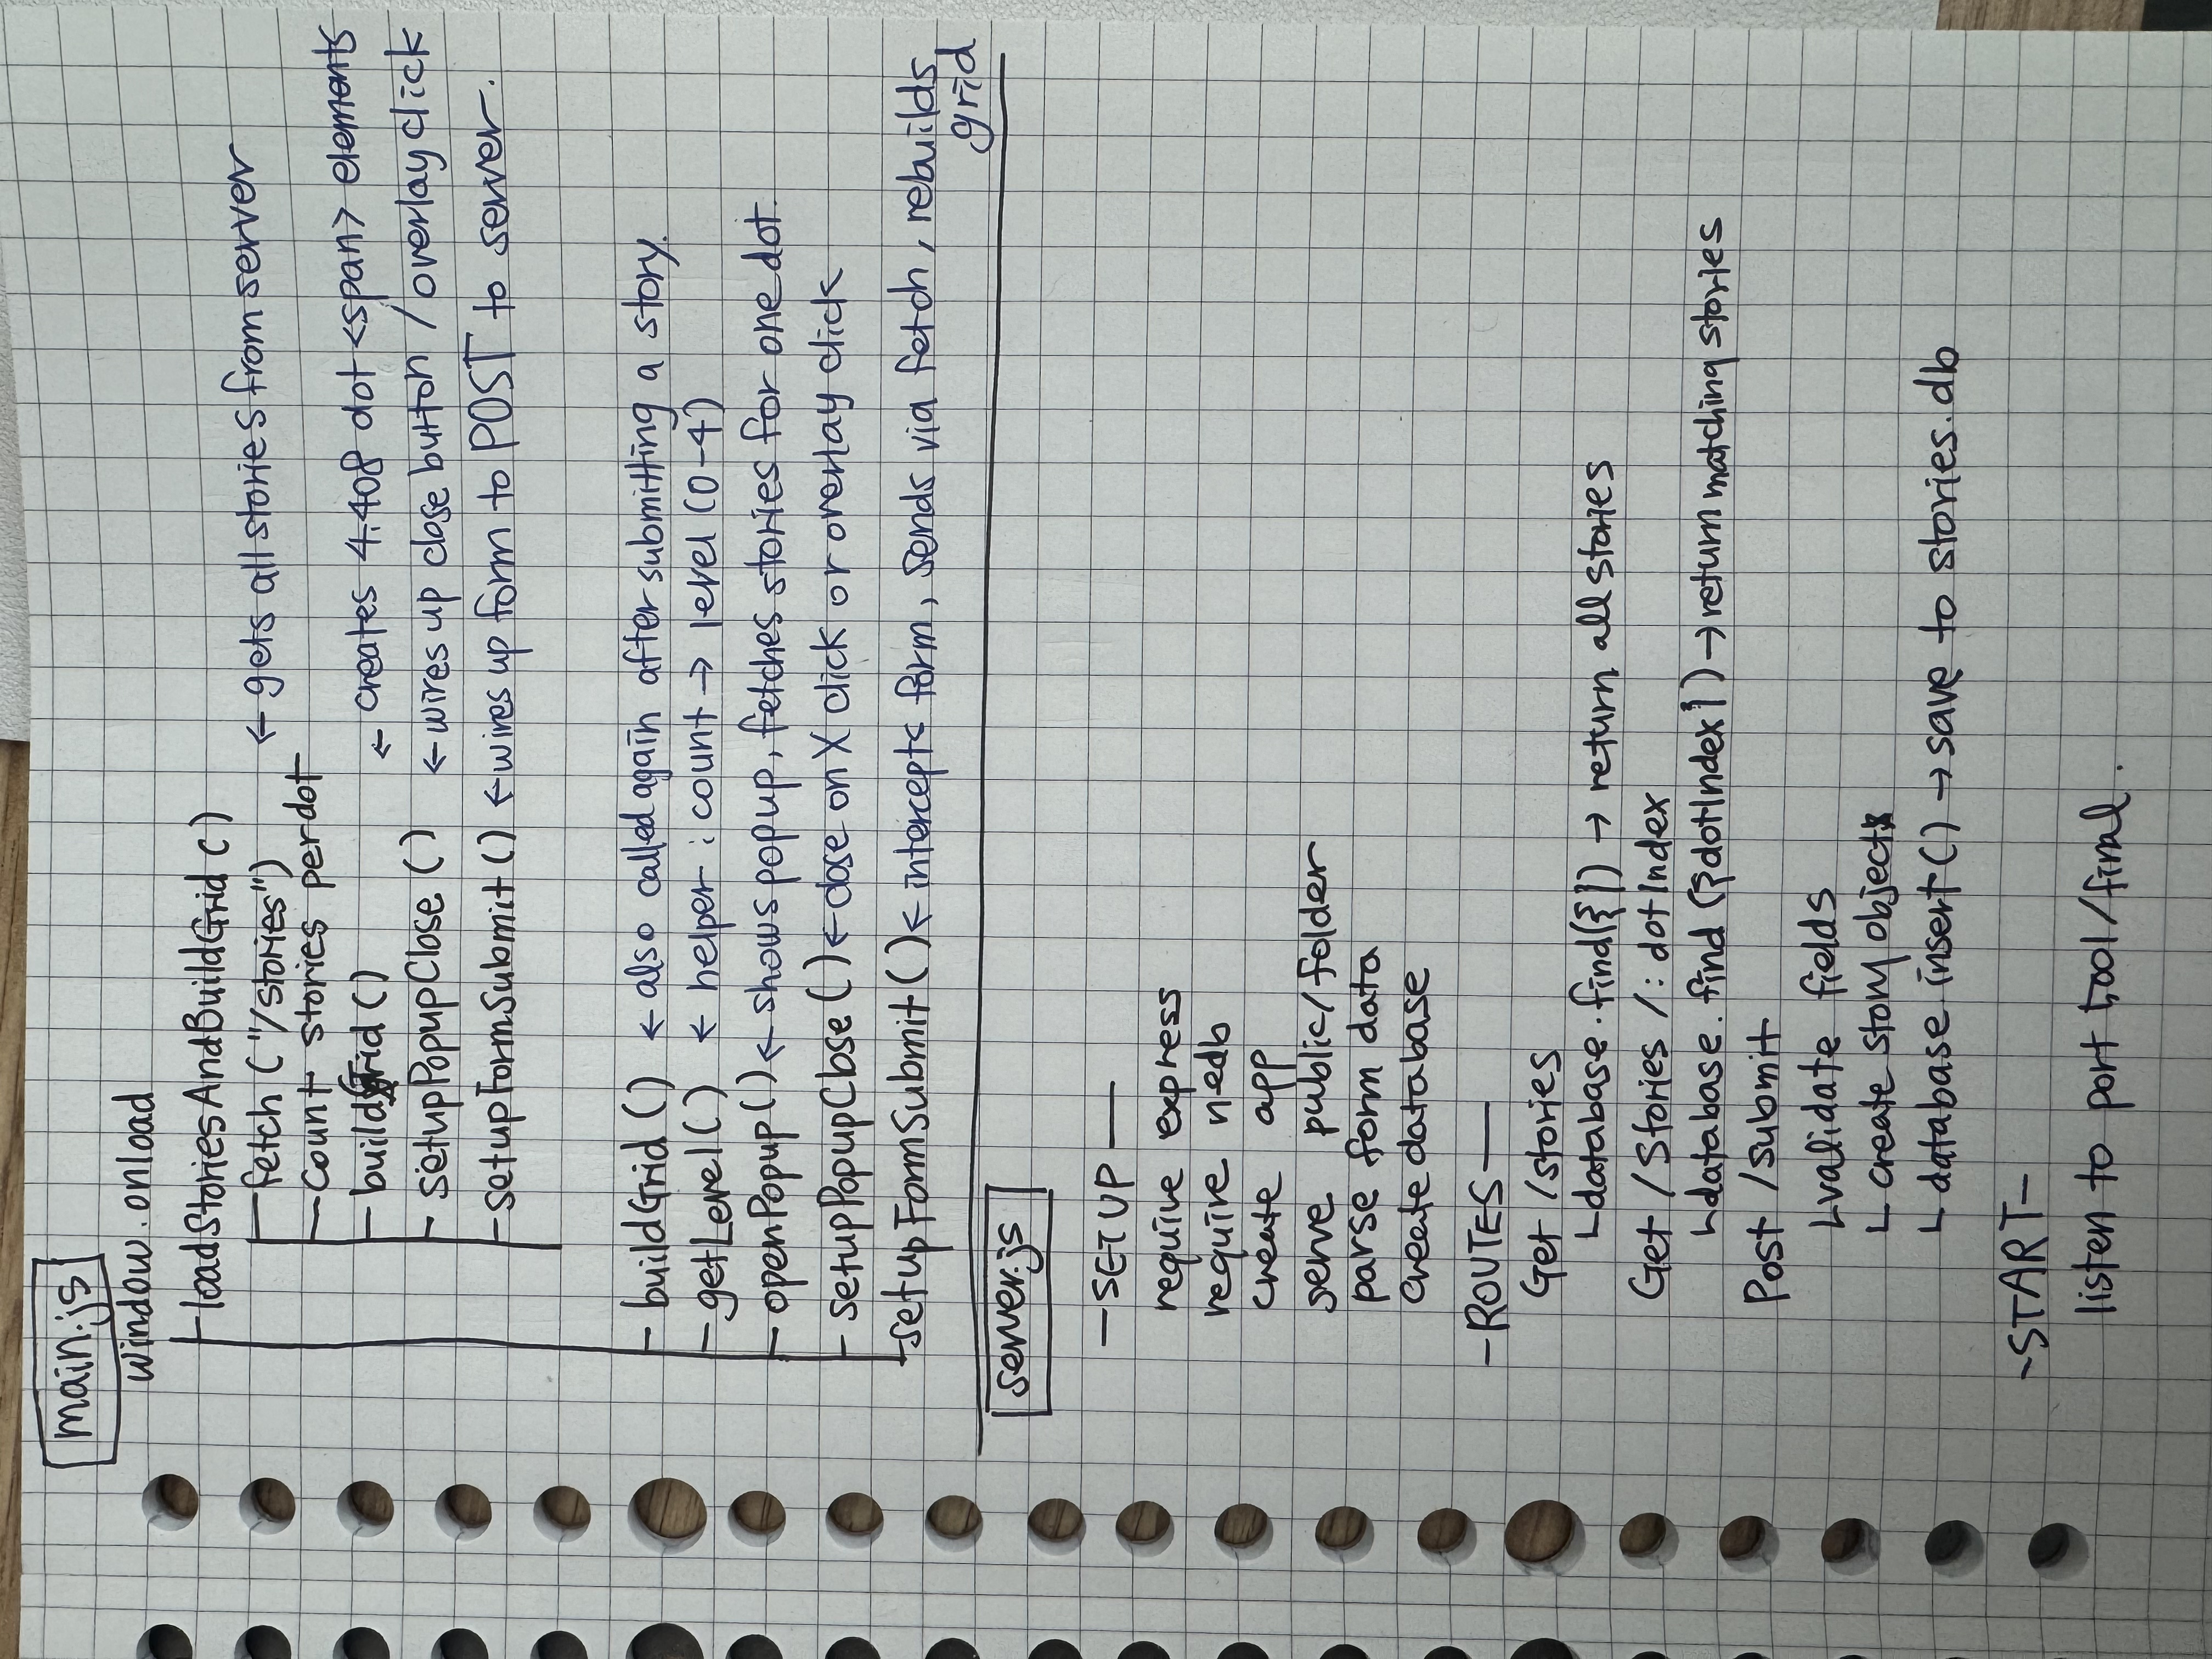
how it all connects:
-
User visits http://138.197.43.202:5001/final/ → express.static serves index.html, style.css, main.js
-
main.js loads → window.onload fires → fetch(“/stories”) → hits app.get(“/stories”) → Server queries database for ALL stories → Sends back JSON → main.js counts stories per dot → builds the grid
-
User clicks a dot → fetch(“/stories/425”) → hits app.get(“/stories/:dotIndex”) → Server queries database for dot #425’s stories → Sends back JSON → main.js shows them in the popup
-
User fills form & clicks submit → fetch(“/submit”, POST) → hits app.post(“/submit”) → Server validates data → inserts into database → Sends back { success: true } → main.js rebuilds grid & reopens popup